Real-Time Cryptocurrency Tracking Dashboard
A comprehensive platform designed to track cryptocurrency prices, analyze market sentiment, and provide real-time insights for informed investment decisions.
December 28, 2024
Web DevelopmentProduct Design
Scroll to explore
Project Details
DURATION
ROLE
TEAM
Dec. 24 '24 - Dec. 28 '24 (4 days total)
Full Stack Developer, UX Designer
Heather Davies (Solo Project)
Introduction
Cryptocurrency is one of the most volatile markets today, making it essential for investors to monitor not only live prices but also the sentiment surrounding each coin. To address this need, I designed and developed a Crypto Price Tracker and Sentiment Analysis App—a full-stack web application that aggregates real-time price data, analyzes the tone of crypto-related news, and provides alerts to help users stay informed and make better decisions.
Goals
-
• Live Cryptocurrency Tracking: Real-time monitoring of the top 10 cryptocurrencies, including Bitcoin and Ethereum.
-
• Sentiment Analysis: A clear understanding of the tone of news articles surrounding each coin, categorized as Positive, Neutral, or Negative.
-
• News Integration: A curated feed of crypto-related news to inform users of market trends.
-
• Price Alerts: Immediate insights into major price changes or shifts in sentiment.
Figure 2: A cropped section of my app showing real-time price updates for top cryptocurrencies (e.g., BTC, ETH).
-
Tools Used
Frontend
-
• React.js: For creating dynamic, responsive, and reusable UI components.
-
• Axios: For making HTTP requests to fetch live data from the backend.
-
Backend
-
• Node.js + Express.js: For building a lightweight server and managing routes and APIs.
-
• CoinMarketCap API: For real-time price data of cryptocurrencies.
-
• News API: To fetch the latest cryptocurrency-related news articles.
-
• Google Cloud NLP API: For running sentiment analysis on fetched news content.
-
• node-cron: For scheduling periodic data updates.
-
Deployment
-
• Heroku: For deploying the application and making it publicly accessible.
Process
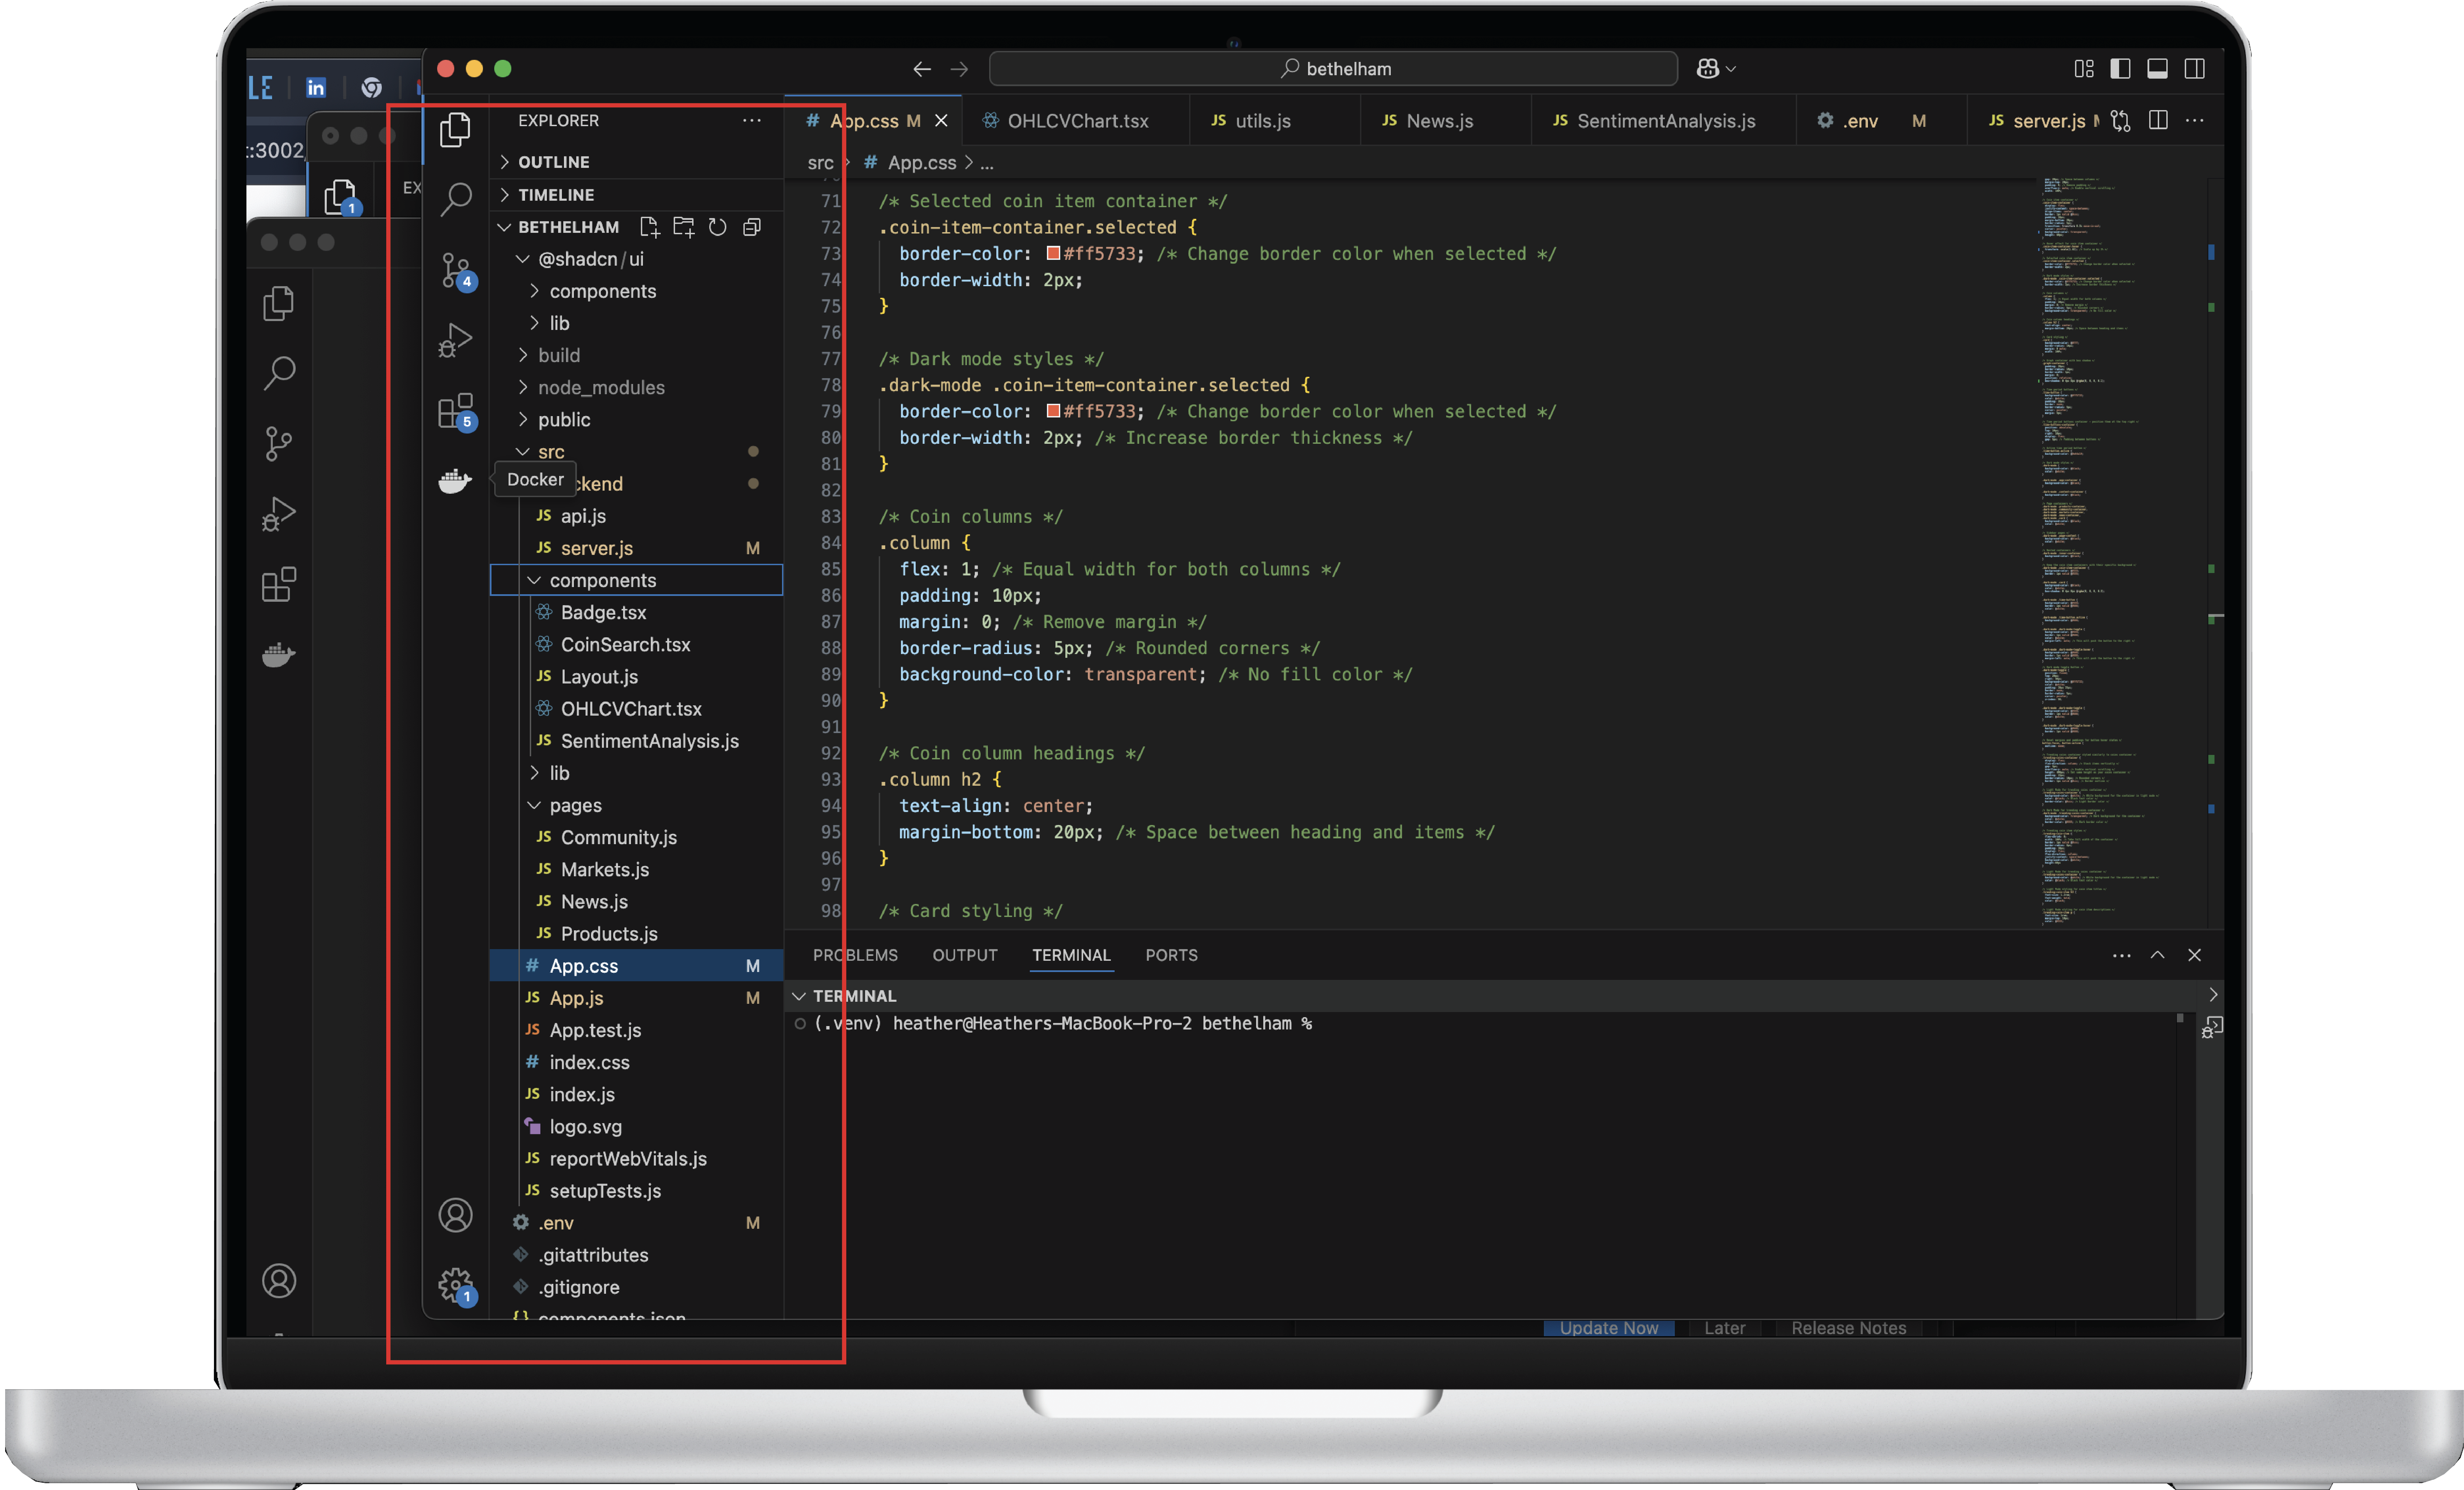
Figure 4: Red highlighted section shows the backend code for the sentiment analysis file organization.
1. Frontend Development
I began by designing the dashboard using React.js, focusing on a modular component structure to handle live price updates, sentiment outputs, and the news feed. This approach allowed smooth updates without full page reloads, improving performance and user experience.
2. Backend Development
The backend was built with Node.js and Express.js, acting as a bridge between the APIs and the frontend. The CoinMarketCap API provided real-time price data, while the News API delivered articles which were then analyzed by Google Cloud's NLP service. Each article's sentiment score was parsed and labeled as Positive, Negative, or Neutral.
3. Sentiment Analysis Integration
The Google Cloud NLP API was used to analyze each news article's sentiment and extract key topics. The results were then categorized into Positive, Negative, or Neutral sentiments, providing users with a quick overview of how the market was feeling about specific coins.
4. Cron Job Scheduling
To ensure the sentiment data remained current, I implemented cron jobs using the node-cron package. These jobs fetched and updated the sentiment data every 12 hours, making sure that users always saw the most up-to-date analysis. This was crucial for keeping the app responsive and relevant, especially given the fast-moving nature of cryptocurrency markets.
5. Deployment
Once the development was complete, I deployed the application on Heroku, a cloud platform that supports Node.js applications. This made the app publicly accessible and ready for use by anyone interested in tracking cryptocurrency prices and sentiment.
Results
The final application is a real-time dashboard that:
-
•
Displays current prices for the top 10 cryptocurrencies.
- • Categorizes the tone of news coverage through sentiment analysis.
- • Shows a live feed of relevant cryptocurrency news articles.
- • Updates sentiment data bi-daily to ensure timeliness.
Users can now track not only the numbers but also the narratives shaping the market.